
NHL 2015-16 Season Preview: How Does Your Team Measure Up?
MONTREAL, QC. — With the NHL season set to open on October 7th, it is the time of year when we are treated to a plethora of predictions. The good folks at Rukkus.com have taken a different approach creating a visually effective infographic to present the makeup of all 30 teams.
Jake Sharpless has collected data on several dimensions including experience, size and plus-minus based on his own assumptions of who will make the final roster. In addition, Sharpless looks at the drafting and development success of the organizations.
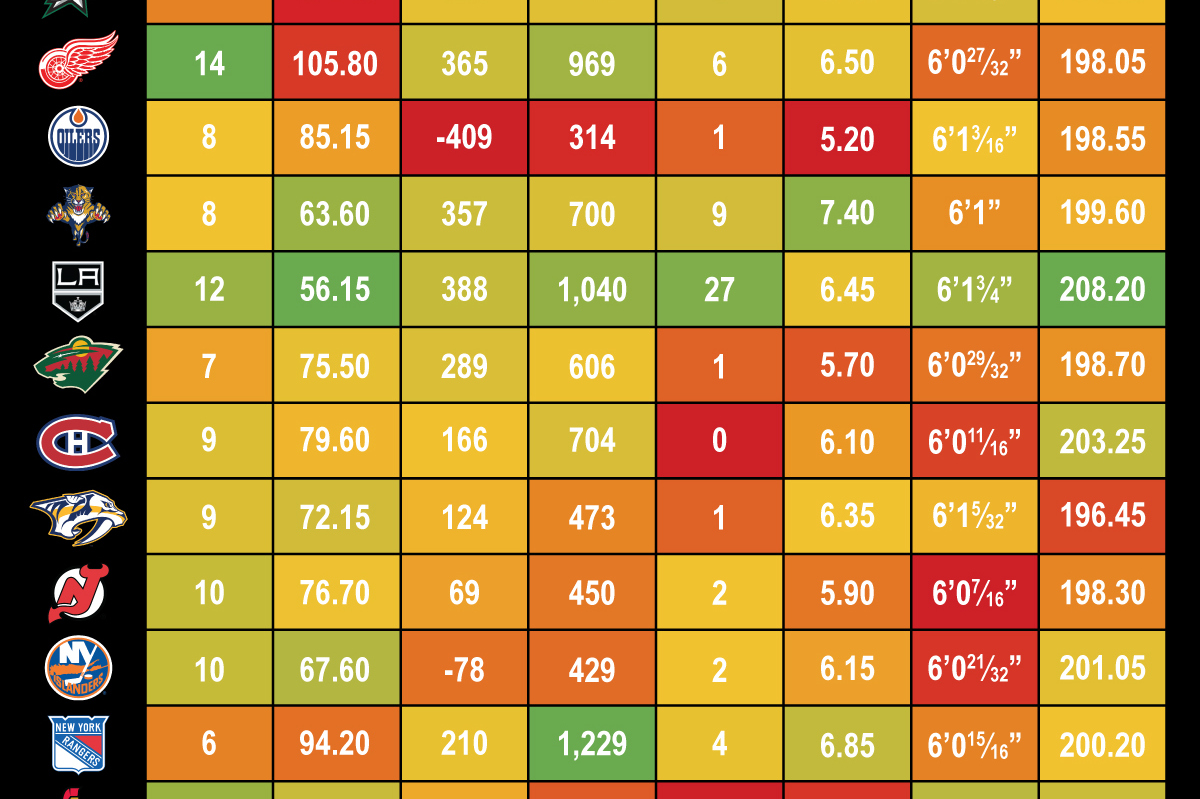
Finally the graphic is colour-coded with green being good and red being at the bottom end of the scale. Find your favorite NHL team and look across. Is the line mostly green? Then you are likely a Los Angeles Kings fan. Sorry Leafs fans, the picture is less positive for you.
Below the chart you will find the methodology provided by Sharpless. You are welcome to leave your comments below.
Homegrown Players on Roster: Looking at each roster, I calculated how many players on the current roster were drafted by their current team. Taking a step back, you can see how wide of a spectrum there is when it comes to roster make up. The Red Wings will skate out 14 players drafted by the organization (70%), highest of any team in the league. The Flyers, on the other hand, only have two players (10%) that were drafted by the team.
Average Draft Position: You’d think that having team full of high draft picks on the depth chart might indicate a lack of recent success as a team. In the case of the Sabres this holds true, but the Kings, just two years removed from a Stanley Cup win, hold the lowest ADP of any team in the league heading into the year. *If a player went undrafted, I noted the lowest draft pick in the year they came into the league and added one.
Career +/- : This one is pretty self explanatory as it is simply the sum of each player on the roster’s career plus/minus. It’s interesting to note that only two playoff teams from last year, the Flames (-15) and Islanders (-78), total up to negative numbers.
Total Career Playoff Games: Surprisingly, the Rangers have the most man games played in the playoffs, surpassing both the Blackhawks and Kings for the title of most experienced roster when it comes to the postseason.
Total Career Cup Wins: This stat obviously skews towards the teams that have seen recent success as the Blackhawks and Kings dominate the category (it’s also important to note that each team has players that have won multiple cups, sending the numbers even higher). Four teams, the Canucks, Maple Leafs, Canadiens, and Senators, lack a single rostered player that has lifted the cup.


Connect with Hockey Pub
Connect with us using social media.